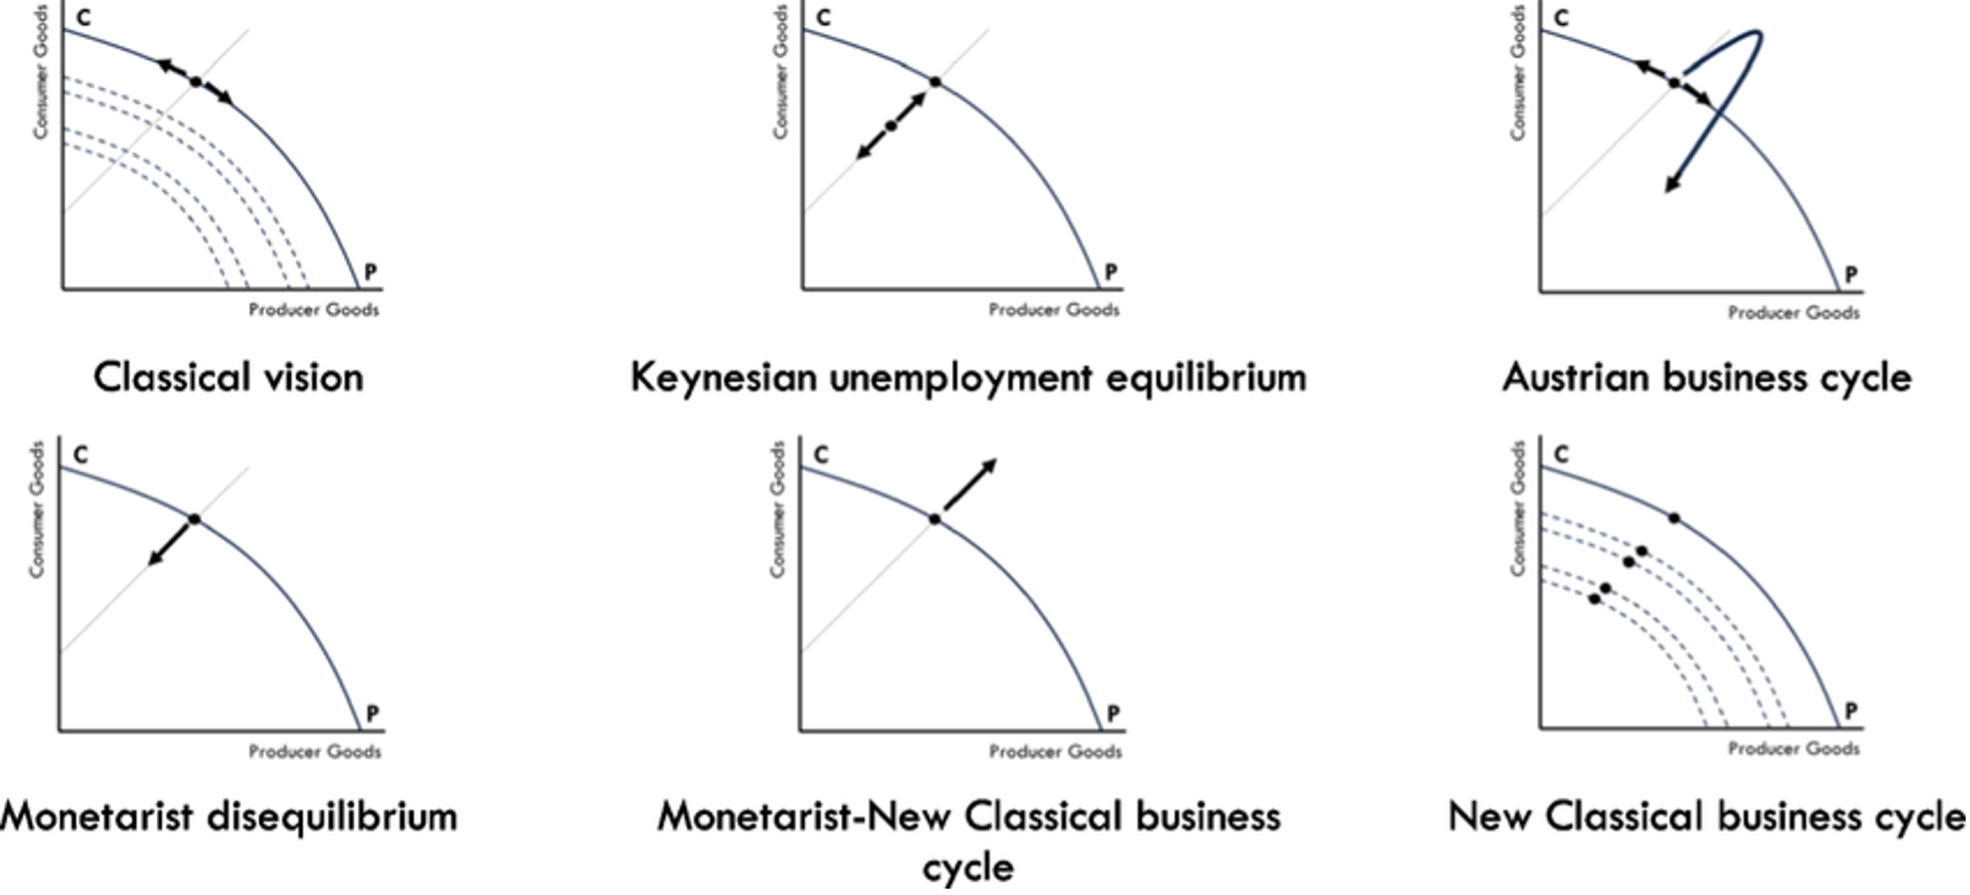
This article examines the business cycle using two techniques. Aggregate consumption, investment, and output are analyzed to determine if they have been substitutes or complements over different expansion and contraction phases. These results are analyzed to assess empirical support for Keynesian (Keynes 1936), monetarist (Friedman and Schwartz [1963] 2008), Austrian (Mises [1912] 1981; Hayek [1931] 1935; [1933] 1966), and other business cycle theories in accordance with Roger W. Garrison’s (2001) typology.
The Hurst (1951) exponent distinguishes between stable and unsustainable time series. Most Hurst studies of financial data use daily or even infradaily observed series such as equity prices. Monthly observed capacity utilization data are more amenable to fractal analysis than quarterly observed GDP, consumption, and investment data. Austrian business cycle (ABC) theory (Mises [1912] 1981; [1949] 1998; Hayek [1931] 1935; [1933] 1966; [1939] 1969; 1941; Garrison 2001) traces the cause of recessions to unsustainable resource allocation imposed by expansionary monetary policy. Money supply growth creates additional funds for investment but simultaneously depresses interest rates, relaxing saver-investor incentives to ration credit to higher-yielding activities and allowing less productive and lower-yielding activities to appear more competitive. These unsustainable lower-yielding activities lower overall productivity, return on investment, and long-term growth. Monetary expansion and lower interest rates also suppress saving and increase consumption spending.
Leading up to the 2001 recession, we saw unsustainable expansions in new technology; prior to the 2007–9 Great Recession, the unsustainable expansion was in finance, construction, and real estate.
The rest of the article is organized as follows. The first section describes the data, the second and third present two types of statistical analysis, and the fourth section discusses the results in terms of ABC theory.
Data
The data are quarterly observed GDP, personal consumption expenditures, and private domestic investment; and monthly observed capacity utilization rates for various industrial sectors—all from the Federal Reserve Economic Data (FRED) database. To isolate business cycle phenomena, we took the eight quarterly or twenty-four monthly observations preceding each downturn and concatenated them to construct a uniform time series for each variable. This was to capture behavior during the unsustainable expansion that precedes a recession. Similarly, series were assembled for two years following each downturn and for the capacity utilization rates, also of two years following each trough, to capture behavior during recovery.
Correlation Analysis of Output, Consumption, and Investment
In Garrison’s (2001, 248) typology of business cycle theories (figure 1), movements parallel to the production possibilities frontier (PPF) indicate that consumer and producer goods are substitutes, which is a feature of the classical business cycle model. Virtually all other business cycle models depict producer and consumer goods as complements, representing the business cycle as movements perpendicular to the PPF. ABC theory is the only model which allows for output movements that are simultaneously perpendicular and parallel to the downward-sloping PPF, further strengthening an expectation of antipersistence. In other words, ABC theory allows the output choice point to move in more directions. Recessions, or at least the unsustainable overexpansion that causes them, should be characterized by systematic disruptions to the normal antipersistence of entrepreneurial experimentation. Recovery restores the market’s normal entrepreneurial antipersistence.

To examine whether consumption and investment are substitutes or complements over the business cycle, we compute Pearson’s (1895) correlation coefficient r. Empirical results on changes in quarterly output (Y), consumption (C), and investment (I) are given in table 1 in the form of a correlation matrix. Each series is isolated for the eight quarters preceding a recession, denoted with the prefix p, and the eight quarters of recovery following each business cycle peak, denoted with the prefix r.
Only two of the correlations are negative, indicating that substitution between consumption and investment does not generally dominate. The two negative correlations are between prerecession consumption and recovery investment, and between prerecession output and recovery investment. Taken together, these two results suggest that the greater the unsustainable growth in output and consumption before a recession, the more investment contracts during the recession. However, both r’s are very close to zero. High positive correlation indicates strong complementarity. However, lower correlations, especially r < 0.5, suggest that more substitution occurs. These results are interpreted as follows.
All pre- to postpeak correlations are low simply because high unsustainable growth in consumption, investment, and output is succeeded by lower or negative growth after the crash (p∆C, r∆C: r = 0.1232; p∆I, r∆C: r = 0.2878; p∆C, r∆I: r = −0.0025; p∆I, r∆I: r = 0.1260; p∆Y, r∆C: r = 0.1503; p∆Y, r∆I: r = −0.0221; p∆C, r∆Y: r = 0.1110; p∆I, r∆Y: r = 0.2306; p∆Y, r∆Y: r = 0.1231). The low correlation between consumption and investment during the unsustainable expansion (p∆C, p∆I: r = 0.1784) indicates that a relatively high level of substitution occurs before a downturn, though complementarity still dominates. The fact that the prerecession correlation between consumption and output (p∆C, p∆Y: r = 0.8768) is so much higher than that between investment and output (p∆I, p∆Y: r = 0.4744) suggests that investment becomes untethered from output growth in the late stages of an expansion. It also suggests the ABC phenomenon of raiding intermediate stages of production to expand consumption and output. The consistently high correlations between postpeak consumption and investment (r∆C, r∆I: r = 0.8224), consumption and output (r∆C, r∆Y: r = 0.9848), and investment and output (r∆I, r∆Y: r = 0.8931) all suggest that more sustainable growth is restored after the reset of the downturn. In the absence of rapid, investment-augmenting technological change, sustainable growth should be predominantly complementary between consumption and investment.
Hurst Analysis of Capacity Utilization
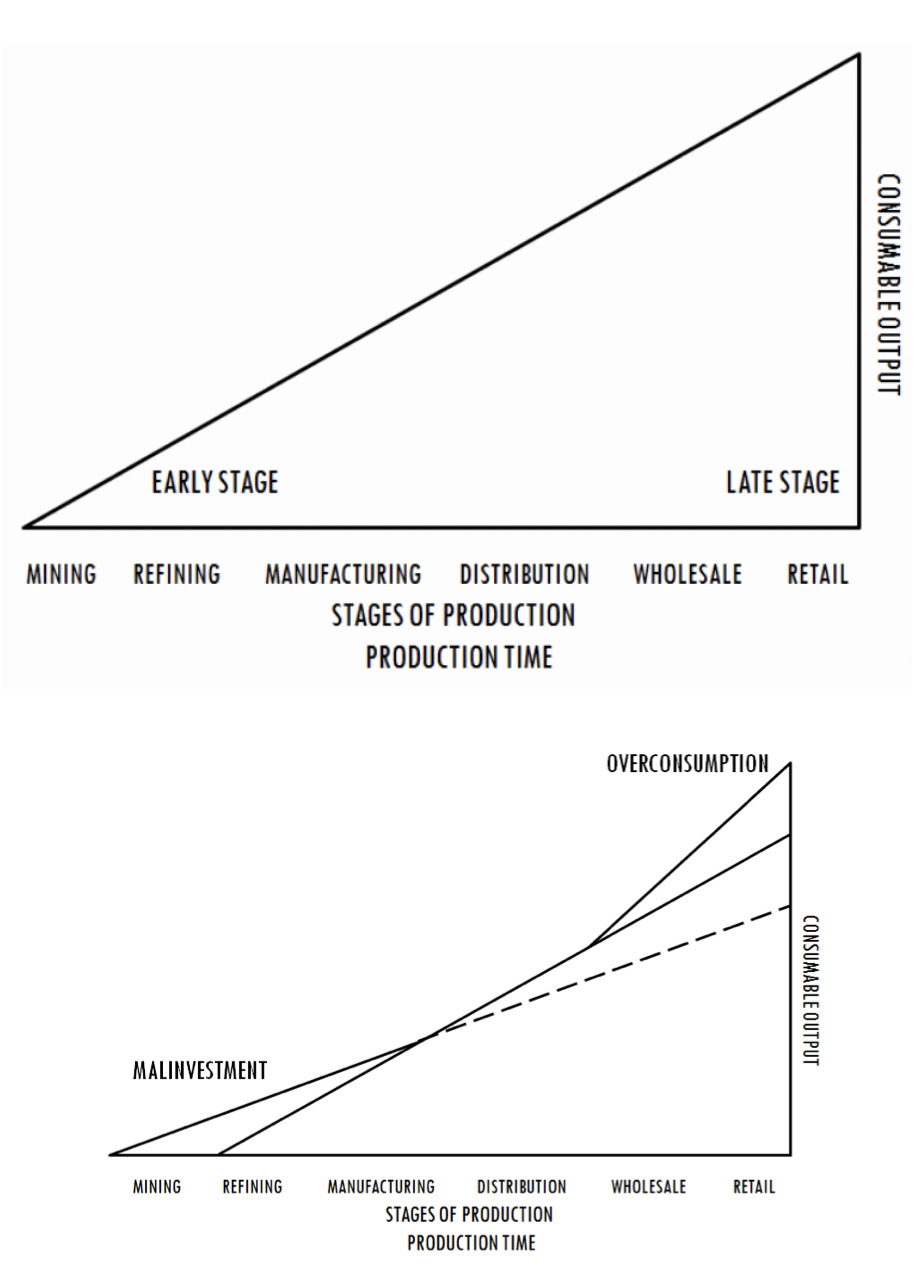
Next, capacity utilization in different Standard Industrial Classification (SIC) and North American Industry Classification System (NAICS) sectors is examined to assess how well these sectors behave in accordance with ABC theory. ABC theory suggests that we should observe different levels of investment and utilization of installed capacity during the unsustainable expansion and after the crash, as well as in early, middle, and late stages of production. In figure 2, mining and refining are the earliest stages of production, with manufacturing and distribution being middle stages and wholesale and retail the latest stages which are closest to final consumption.
_and_unsustainable_production_.png)
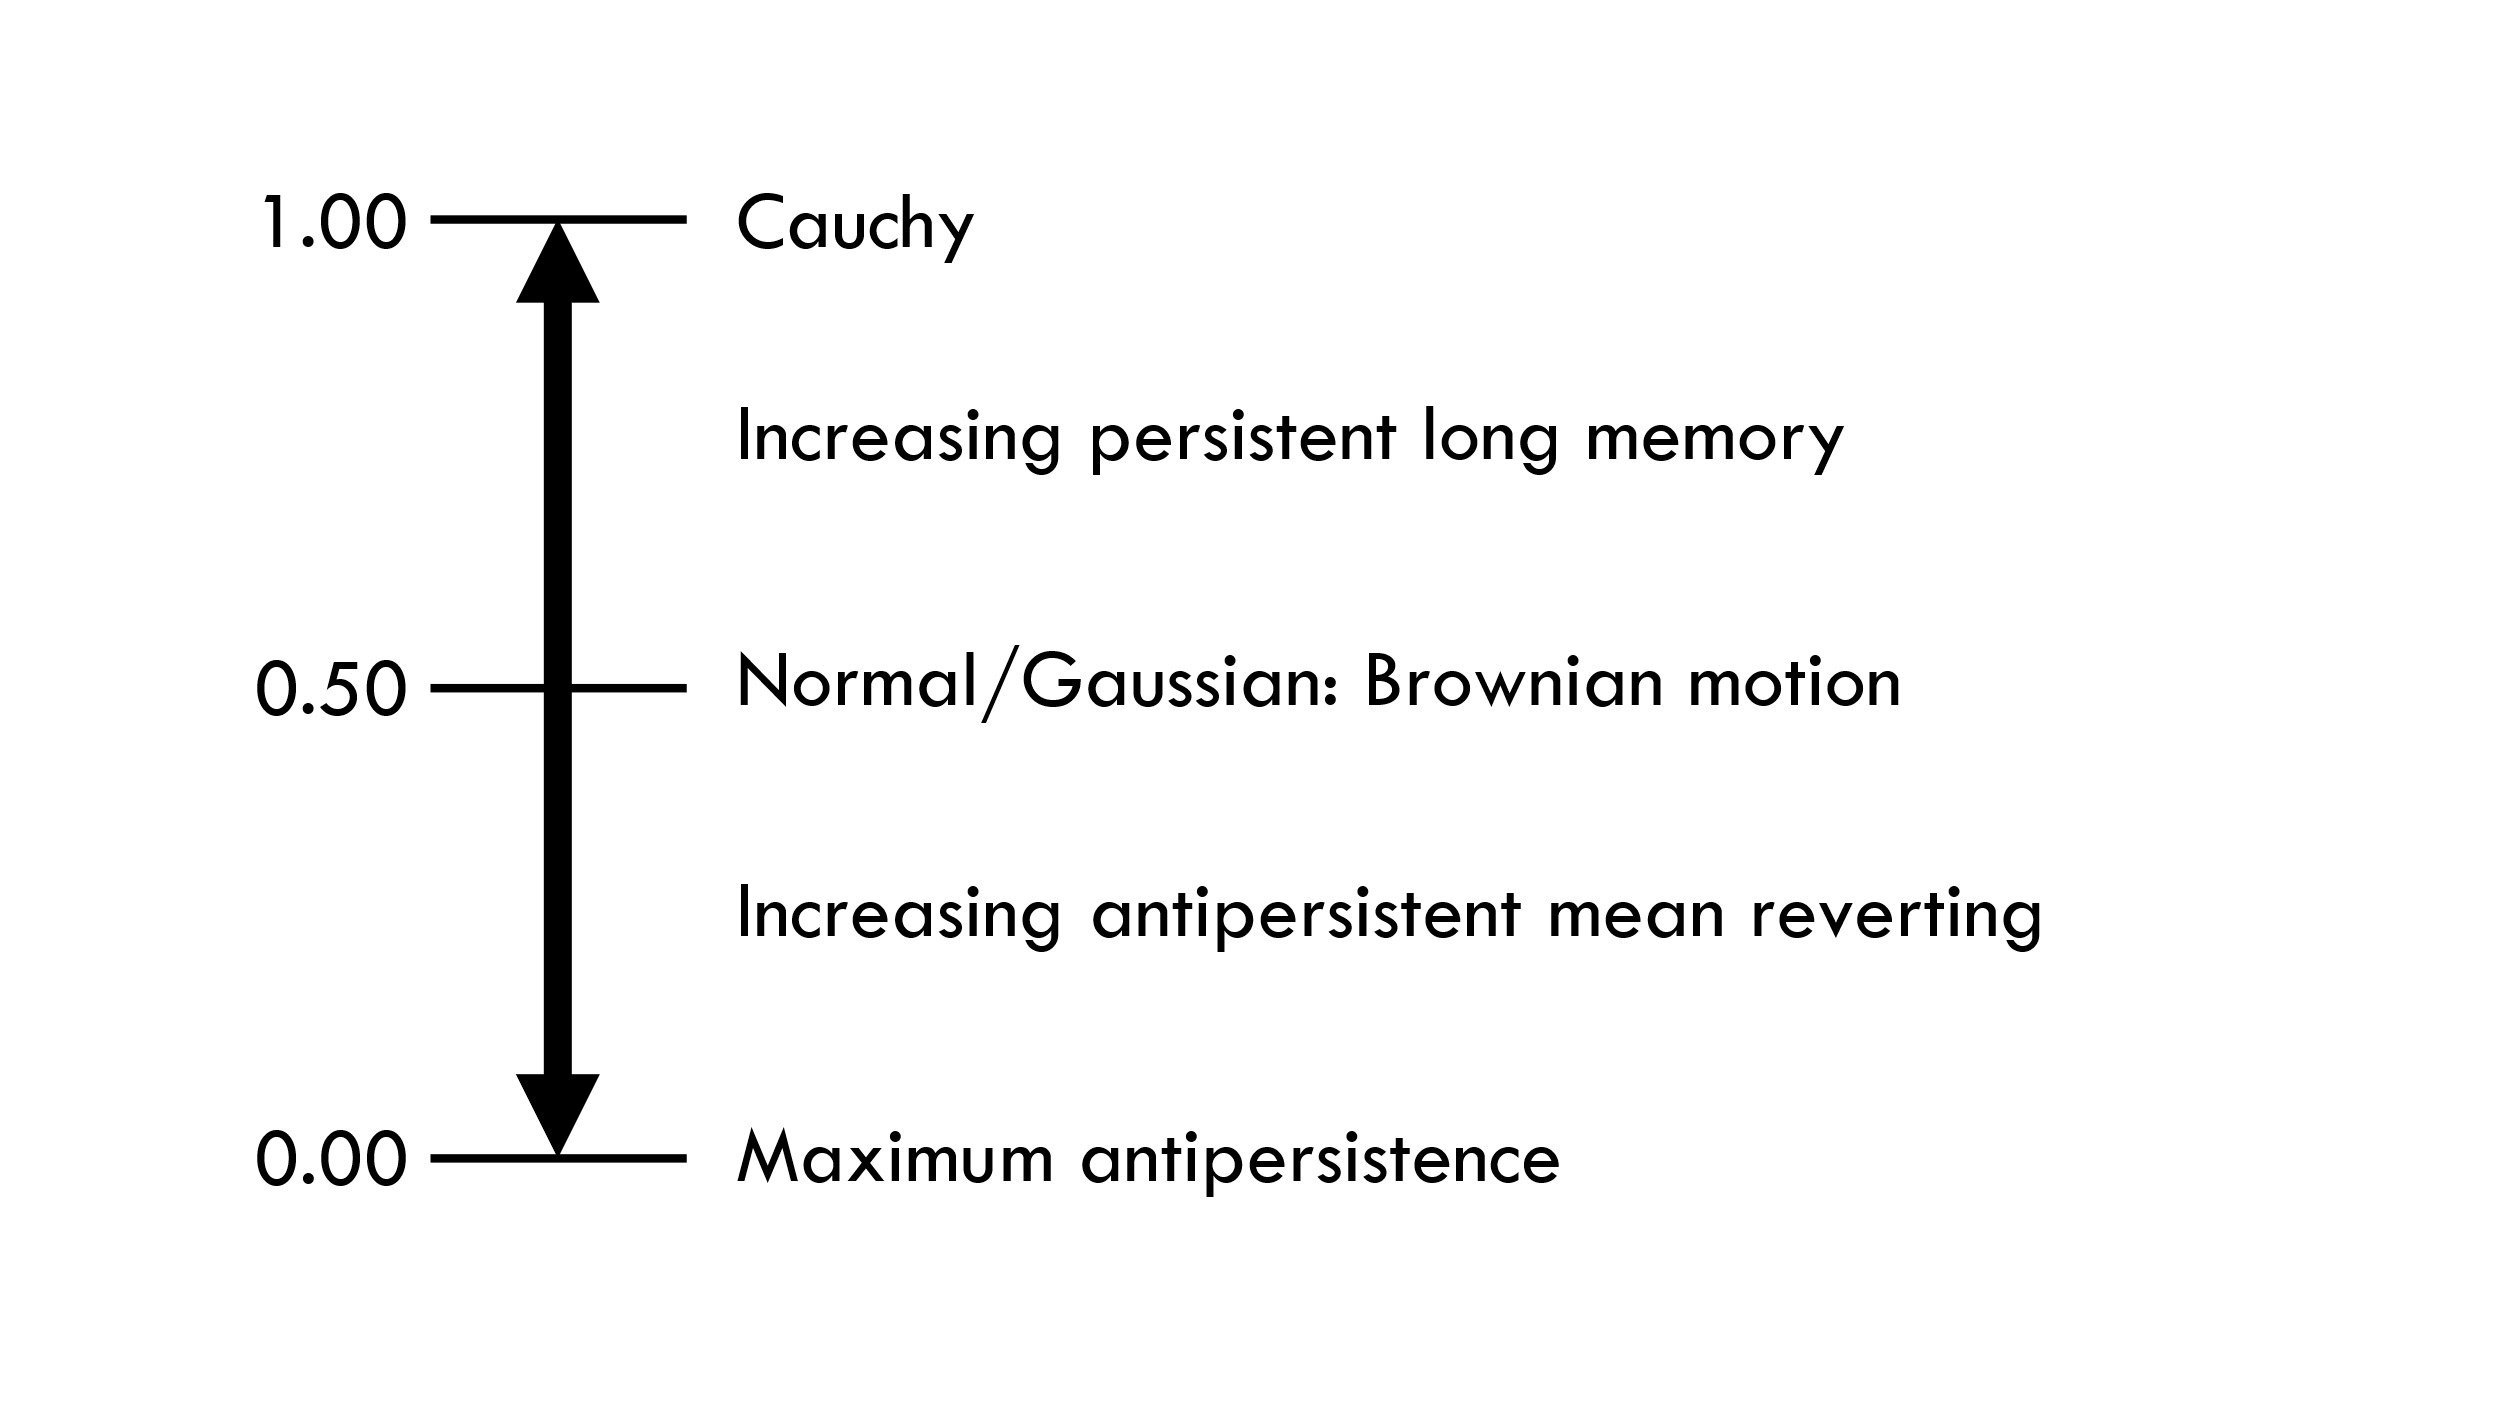
The Hurst exponent was introduced for hydrological studies of the Nile (Hurst 1951). It measures the relationship between variable inflows and the reservoir necessary to guarantee a constant or constantly cyclical outflow. Inflow variability can range from completely random to constant or periodic. In macroeconomics we apply the Hurst exponent to assessing the sustainability of a time series. With capacity utilization rates, H measures persistent long memory, ranging from 0.5 for the normal, or Gaussian, distribution to 1 for the extremely fat-tailed Cauchy, or Lorentz, distribution. However, as shown in figure 3, many macroeconomic time series, far from displaying persistent long memory, display antipersistent long memory, or negative serial correlation, with 0 ≤ H < 0.5.
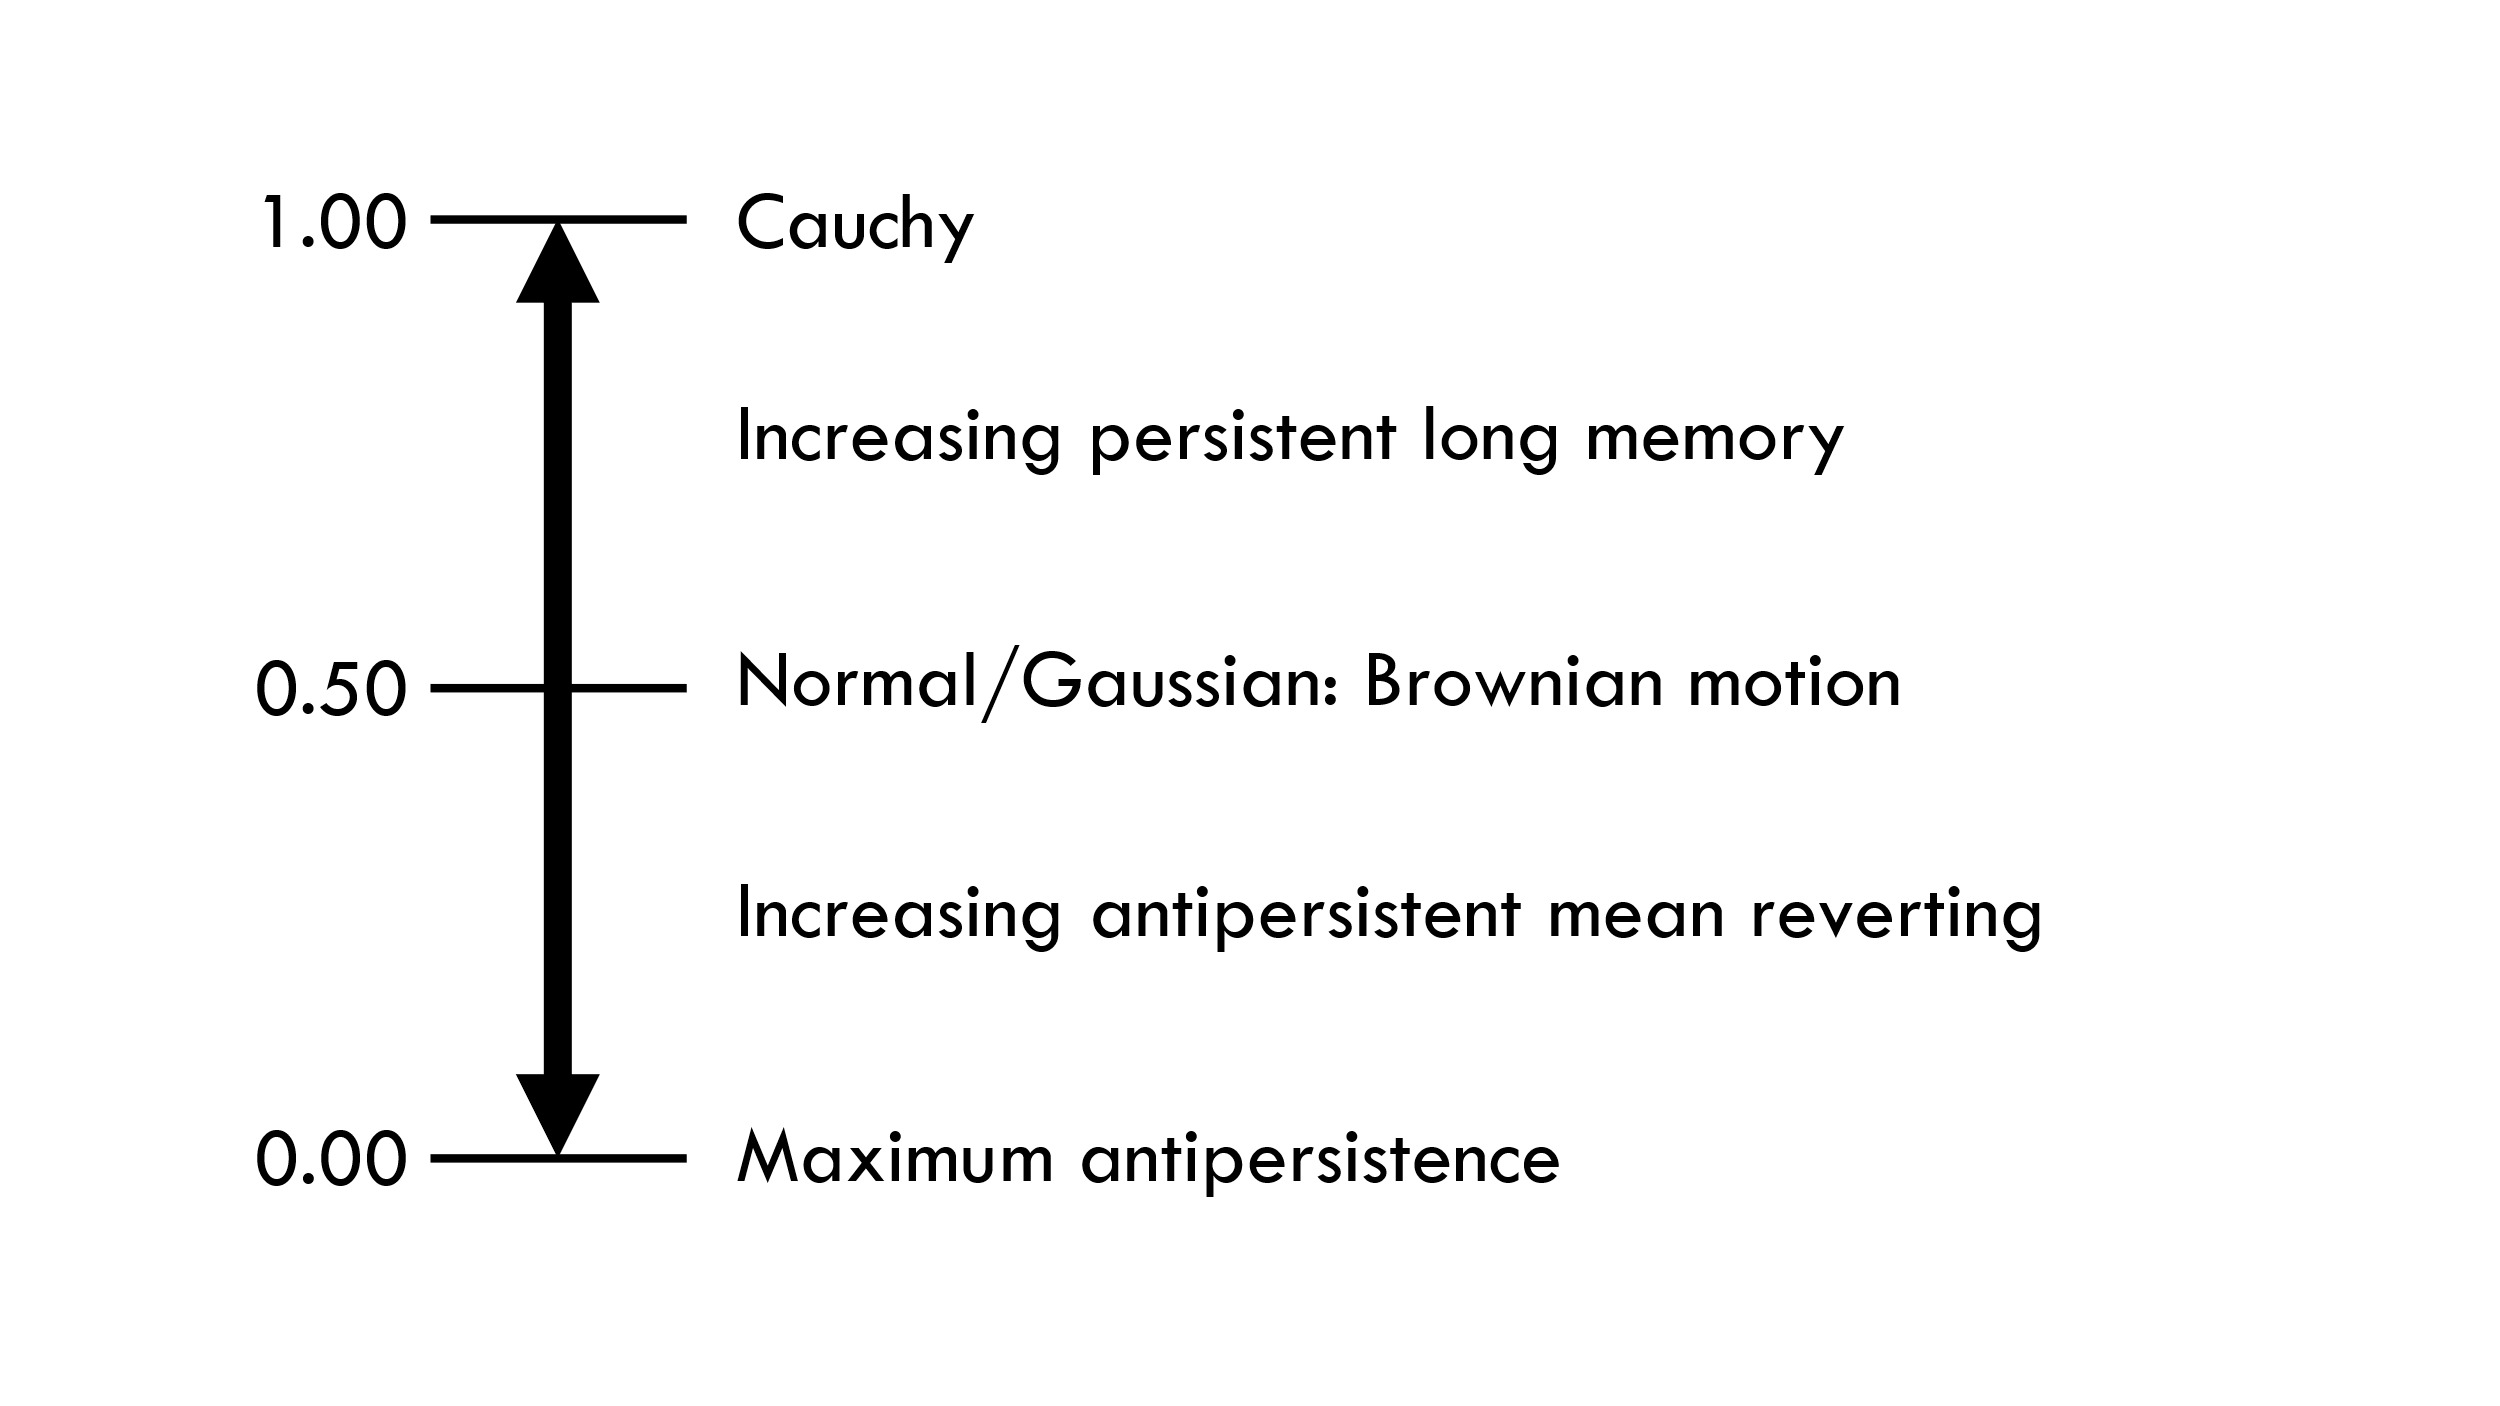
Hurst analysis of capacity utilization enables us to distinguish between (a) sustainable resource allocation driven by organic changes in supply and demand due to ordinary entrepreneurial experimentation (antipersistent long memory, where H < 0.5) (Peters 1999) and (b) unsustainable Cantillon effects (Blaug 1985, 21) due to monetary expansion and herding behavior (persistent long memory, where H > 0.5) (Koppl 2002).
The conventional rescaled-range (R/S) method introduced by Benoit Mandelbrot (Mandelbrot and Wallis 1969; Mandelbrot 1972; 1975; 1977) requires at least 48 observations. Roughness-length, power spectrum, and variogram methods require a minimum of 120 observations. The present article concatenates twenty-four-month prerecession, postpeak, and posttrough series to achieve sufficiently long time series for power spectral density analysis. This provides three Hurst estimates for each industrial sector, from which implications can be drawn for how the fractal character of capacity utilization evolves from the unsustainable expansion which precedes a downturn to the malinvestment liquidation of the initial recession to the recovery which follows. These evolutionary processes and their fractal character can be compared across early, middle, and late stages of production. The monthly frequency is less of a problem than more-sparse data, such as quarterly observed GDP, consumption, and investment (Xu et al. 2009).
Because Hurst exponents may vary over time for each series, it becomes attractive to estimate H separately for each recession, especially since the longer concatenated series analyzed here can be complicated by irregular data sampling (Aldroubi 2002). This will be accomplished in a follow-on paper. These shorter series must be estimated through wavelet functions. The length of time series for each recession, twenty-four months, approaches the lower limit (16 observations) for which Hurst exponents can be estimated by wavelets (Mulligan 2024; 2025). Wavelet estimation of H is often superior to other methods (Simonsen et al. 1998; Wu 2020), though potential small-sample bias must be kept in mind in interpreting results. Wavelet estimation compares favorably to Fourier power spectral density analysis when larger samples are available (Said and Pearlman 1996; Atto et al. 2016). However, for short samples, wavelets outperform the Fourier power spectrum method by a large margin (Simonsen et al. 1998).
Table 2 reports Hurst exponents for capacity utilization in various industries; they were computed by power spectral density for the twenty-four months prior to the onset of a recession, following the onset, and following the end of each recession. Prerecession Hs are generally lower for early and late stages of production, where installed capacity and capacity utilization both rise unsustainably during the late stages of an expansion. These low Hs indicate greater antipersistence in early- and late-stage activities; however, Hs rise systematically after the onset of recession, suggesting that herding and long memory begin to take hold. In middle-stage activities, Hs are generally higher before the crash and also rise after it. Hs in all sectors generally fall after the recession trough.
Far greater antipersistence (H < 0.5) is evident for most early- and late-stage activities during the unsustainable expansion which precedes a recession than for middle-stage activities. Early- and late-stage activities are the ones which overexpand the most before a downturn and contract the most during a recovery. Persistent long memory (H > 0.5) is only strictly observed for the prerecession post–Bretton Woods manufacturing and the natural gas distribution series; the postpeak mining, electrical equipment, and mining, oil, and gas series; and the posttrough nonmetal durable manufacturing and mining, oil, and gas series.
Austrian Business Cycle Theory
Because physical capital is longer-lived than consumption goods, large accumulations of low-yielding capital persistently suppress growth and output. After the downturn, firms reallocate this equipment and other installed capital to alternative uses which are predominantly lower-yielding and less productive than originally anticipated but still higher-yielding than the capital would be in the unsustainable production plans formulated before the downturn.
Although physical and human capital are long-lived in one sense, the subjective expectations that confer capital character on them can change rapidly as entrepreneurial planners discover new information or disrupt the status quo. This creates a natural expectation of antipersistence as entrepreneurial plans are experimentally entered into and abandoned, expectations are revised, entrepreneurs exit and enter markets, new information is received, acted on, and developed, and so on.
Nicolás Cachanosky and Peter Lewin’s analysis of subjective valuation and production structure focuses on the need for entrepreneurial plans to be adaptable as business conditions evolve and opportunities are perceived. Awareness of changed conditions can cause entrepreneurs to rapidly change their valuation of different capital combinations (Cachanosky 2014; Cachanosky and Lewin 2014; 2016; 2018), further suggesting antipersistent output processes.
Entrepreneurial experimentation normally imposes antipersistence on output, but this will be impaired if expansionary monetary policy degrades the information contained in market prices, imposing shorter time horizons and herding behavior on entrepreneurial planners (Lewin and Cachanosky 2018; 2019; 2020a; 2020b). This will lower the market’s natural entrepreneurial antipersistence, raising H toward 0.5, and may impose persistent long memory. We would expect to find the strongest evidence for this effect during the unsustainable expansion leading up to the onset of recession.
Monetary expansion is the prime suspect for imposing systematic long memory, or at least for reducing antipersistence before a recession, because it has an economy-wide effect in depressing interest rates. Although this is an undiscriminating phenomenon, it generally has stronger effects in particular areas of the economy, which overexpand persistently and unsustainably. These unsustainable overexpansions are Cantillon effects (Blaug 1985) focused in particular industries, and though they can be difficult to observe ex ante, they generally become obvious after the onset of a recession. We saw the technology sector expand before the 2001 recession and real estate, construction, and finance do so before the 2007–9 Great Recession. Cantillon effects impose further persistent long memory because they are concentrated in certain sectors.
Conclusion
Mulligan (2014; 2017) found strong evidence of antipersistent long memory in resource prices, output, and capacity utilization (0 ≤ H < 0.5), so the result found here is entirely consistent. Examination of the 1919–2022 US index of industrial production for multifractal long memory over business cycle expansions and recessions shows that recessions occur when the market’s normal antipersistence and entrepreneurial innovation are swamped by an exogenous factor, such as expansionary policy, that imposes persistent long memory (Mulligan 2017). This seems to prime the economy for a correction that restores its naturally resilient antipersistent processes of independent, uncorrelated, competitive entrepreneurial experimentation.
We examined whether capacity utilization, consumption, investment, and general output are driven predominantly by organic changes in supply and demand and the random entrepreneurial innovations responding to them (antipersistent long memory) or by unsustainable Cantillon effects of systematic monetary expansion (persistent long memory). Interestingly, we found more evidence of persistent long memory and herding behavior during the recession, as the economy responds to the resource misallocation and malinvestment of the unsustainable expansion, than during the expansion itself or during the recovery that follows the recession. Hurst analysis indicates that the multifractal character of capacity varies systematically during recessions and expansions, and that recessions invariably disrupt the economy’s natural, entrepreneurially driven antipersistence. It is especially remarkable that antipersistence can be observed so strongly and consistently in sectoral capacity utilization rates which are highly aggregated time series observed at one-month intervals. Recovery only comes as the entrepreneurial planners who drive the market process restore the economy’s resilience and innovation.